

The fight against modern slavery is global and effects every race and age; however, those most at risk for exploitation are children, including those right here at home. Despite great efforts and awareness, all too many eyes remain closed to the realities of modern slavery and the innocent victims it holds in it’s relentless grasp. One child victimized by the unspeakable acts of sexual exploitation and human trafficking is too many. Nonetheless, every year in the United States experts estimate at least 100,000 children — some 274 children a day — are exploited in the U.S. commercial sex industry. The average age of a child when she or he is first sexually exploited through prostitution is 13 years old.
Last week on November 29, Shared Hope International released its 2012 Protected Innocence Challenge. “The Protected Innocence Challenge is a comprehensive study on existing state laws designed to inspire and equip advocates. Under the Challenge, every state receives a Report Card that grades the state on 41 key legislative components that must be addressed in state’s laws in order to effectively respond to the crime of domestic minor sex trafficking. In addition, each state receives a complete analysis of this 41-component review and practical recommendations for improvement.”
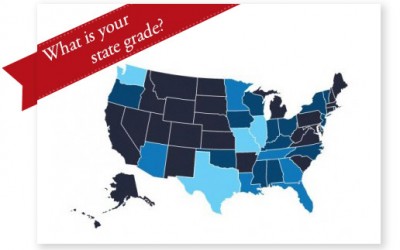
DID YOUR STATE MEET THE GRADE?
Sadly, no states received an A, and more states received an F than any other grade. With nearly as many coming in with a D, it has left us with 69% of our States failing to even reach the C mark.
A (0)
B (7) – FL, GA, IL, LA, MO, TX, WA
C (9) – AK, AZ, IN, MA, MN, OH, OK, TN, WI
D (17) – AL, CO, DE, IA, KY, MD, MS, NE, NJ, NV, NY, NC, OR, RI, SC, UT, VT
F (18) – AR, CA, CT, DC, HI, ID, KS, ME, MI, MT, NH, NM, ND, PA, SD, VA, WV, WY
Despite the low rankings among the majority of states, this year’s report card showed significant improvement, but states still have a long way to go.
- 15 states improved their grades from 2011.
- 2 states went up two grades: AK and MA went from F to C.
- 13 states went up one grade:
- 3 new “B” states: LA, FL, GA
- 6 new “C” states: AK, IN, MA, OH, OK, WI 6 new “D” states: CO, MD, NE, NV, SC, UT
- 7 states improved their Protected Innocence Challenge scores by 10+ points:
- MA went up 29.5 pts
- WV went up 21 pts
- LA went up 17 pts
- SC went up 17 pts
- AK went up 14.5 pts
- OH went up 12 pts
- WI went up 10 pts 3
Each state was scored based on six categories of law. Some states have achieved perfect scores in sections 1 and 6, with “near perfect” scores in the other areas of law:
- Criminalization of Domestic Minor Sex Trafficking: IL and TX have perfect scores (10 points possible)
- Section 2 Criminal Provisions Addressing Demand: LA now has a “near perfect” score with 24.5 points (25 points possible)
- Criminal Provisions for Traffickers: MS, KY, FL and AL have a “near perfect” score with 14.5 points (15 points possible)
- Criminal Provisions for Facilitators: LA and WA have a “near perfect” score with 9.5 points (10 points possible)
- Protected Provisions for Child Victims: IL is the closest to a “near perfect” score with 24.5 points (27.5 points possible)
- Criminal Justice Tools for Investigation and Prosecution: AL, MN, OH and TX have perfect scores (15 points possible)
- Most Improved = MA
- Highest Score = LA
- Worst score = WY
Looking at legislative progress over the past year since the release of the 2011 Protected Innocence Challenge,*
- 240 state and 38 federal bills were introduced which relate to domestic minor sex trafficking.
- 78 laws were passed that relate to domestic minor sex trafficking.
- 40 states had legislation introduced that relates to the Protected Innocence Framework.
- 33 states enacted legislation related to the Protected Innocence Framework.
The release of the Protected Innocence Challenge report was done in conjunction with Sharing the Hope 2012 in Washington, D.C., a three-day event which included community and law enforcement training and the National Colloquium — a forum of national experts on the issue of shelter and service provisions for child victims of human trafficking. The final day of the event culminated with the Sharing the Hope Gala and Pathbreaker Award Ceremony honoring Ernie Allen, President and CEO of the International Center for Missing and Exploited Children; Drew Oosterbaan, Chief, Child Exploitation and Obscenity Section (CEOS) of the U.S. Department of Justice; Amy O’Neill Richard, Senior Advisor to the Director in the State Department’s Office to Monitor and Combat Trafficking in Persons; and Deborah Richardson, Executive Vice President of the National Center for Civil and Human Rights.
The full report can be found and downloaded here.
*Statistics are based on Congressional Quarterly State Track accounting for legislation introduced or passed between August 1, 2011 and August 1, 2012.